The only way to beat the competition is to stop trying to beat the competition.
TL;DR: The domain of UML design software is an area with heavy competition and many strong and settled players. Yet, entering a new niche in this market is still possible, but requires focusing on novel approaches and questioning established practices.
This is the second post in the series about the initial idea behind UMLBoard. While the first entry was about identifying users’ demands, I want to conclude this series by shedding some light on how UMLBoard tries to create the most value to customers without staying in direct competition with other UML designers.
Swimming in an ocean of uml tools
Defining the proper scope for a project is not easy, and there is often the risk of leaving out important aspects or implementing features that don’t provide real value. For determining the initial feature set of UMLBoard, I followed an approach based on the book The Blue Ocean Strategy1.
So far, I haven’t been a big fan of these management books, as most of them describe strategies that don’t apply very well to my specific case - setting up a small app-based side project.
But I must admit the Blue Ocean Strategy really helped me to discover what could be the Most-Valuable-Product for users and which features I could leave out. Of course, I did not follow the book step-by-step, instead I only picked the parts I considered helpful for me. Still, I hope sharing some of my insights might help others set up their own side projects.
The general idea of the authors is that you can distinguish between two types of markets, epxressed as oceans:
-
Red oceans are overcrowded markets with many rivals competing against each other. The market is mainly saturated, and vendors are forced to fight for remaining customers. These confrontations literally result in blood in the water, hence the name. Surviving in such an environment requires strong resilience and enormous resources.
-
Blue oceans on the other hand, stand for market areas that are relatively unexplored with limited or no competition. Finding new customers in this market is possible by providing real value and focusing on their demands.
As we’ve seen in our previous post, the ocean for UML tools is already quite crowded: There are full-blown UML editors and general diagram designers, but also text-based solutions, e.g., for markdown editors. Many of these tools already exist for quite some time and have a notable audience. Competing with them by providing (or better: trying to provide) a similar set of features would be a daunting task.
Instead, the idea for UMLBoard was to find out what users needed but was missing from existing tools and how, on the other side, resources could be saved by skipping functionality considered non-essential.
finding characteristics
To find out what to add (or remove) from existing UML tools, one has to first identify some of the essential characteristics that play a crucial role in the market. The authors of the Blue Ocean Strategy refer to these aspects as principle factors.
Okay, but what are these factors, and how could they be identified?
What helped me here was asking questions like what features everybody needs when designing UML diagrams? or what are typical functions implemented in any UML tool?
Of course, these factors might be subjective and depend on what one considers essential or not when working with UML tools. To be as objective as possible, I relied on some user studies (see again the previous post in this series) to decide which characteristics to take.
Let’s have a look at some of the typical factors I identified that many UML design tools have in common:
-
User interface complexity
measures how many controls the UI is composed of and how many input actions are needed to complete a specific task. As this factor might correlate with the number of available features, full-blown UML designers tend to have a relatively complex UI, while more general drawing tools, in contrast, might be a bit easier to handle. -
Number of supported diagram types
Most design tools support a large number of diagram types: UML alone has between 11 and 14 different diagram types (depending on who you ask) with different semantics, while more generic diagram designers provide even more types like Petri-Nets, network diagrams, and many, many more. -
How strong are UML rules enforced
This criterion measures how well the tool is able to understand what is drawn and whether it can validate the diagram for potential errors or validations. See this article for a good summary of this topic. Of course, proper UML design tools are powerful in this discipline. -
Entry barriers
How long does it take users to create their desired results with the tool? Are there any barriers that hinder users from starting to work right away? This could be an unintuitive user interface that requires the consultation of a manual, a complicated configuration setup, but also other processes, such as upfront or mandatory online registration. -
Possibility to create informal or conceptual design
This is a relatively specific factor that was mainly created for UMLBoard (see below). It expresses whether the tool’s focus lies more on small, conceptual drawings or whether it’s more on designing complex and detailed models. Again, most UML designers tend to the latter direction here. -
Pricing
While this might look obvious, measuring a tool’s actual costs is not easy: There is often a free version with a limited feature set, but accessing all functions then often requires a monthly or yearly subscription. Whether this freemium model is enough depends on one’s individual needs and is difficult to quantify.
To simplify our market model a bit, I grouped the available UML tools into two separate groups:
-
The one group represents designers primarily used for model-driven development approaches. They support most UML diagrams together with their semantics.
-
The other contains design tools that are more general and often used for drawing informal UML diagrams. Since they are also used by developers or users unfamiliar with all UML semantics, these applications are usually easier to access.
Of course, this categorization is a strong simplification, as many other tools with various features and use cases exist. Still, I would say that these two groups cover the characteristics of most UML tools quite well, at least for our investigation.
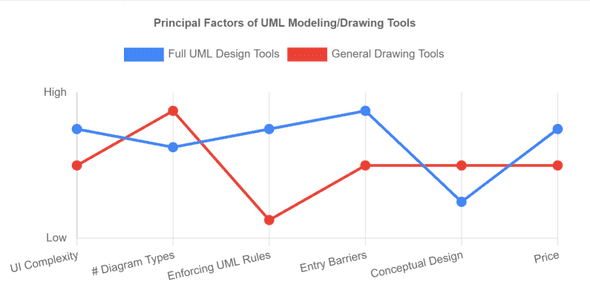
If we give each factor a value of either Low or High, depending on how vital the corresponding characteristic is present by any given tool of each group, we get the following graph:

Both application types support many diagram types and must provide the corresponding UI elements for letting users create and edit all these diagrams. This results in relatively high values for both UI complexity and the number of available diagrams in both types of designers.
Besides that, most UML designers are often more decisive in enforcing UML semantics and thus have higher entry barriers: They might need upfront decisions (which diagram to take, which rules to enforce etc.) or additional configuration steps (link to requirement specifications, code generation setup, and others).
Also, many commercial modeling or drawing tools are based on a SaaS business model, often requiring an online subscription to access all available functionalities.
The graph we created describes the most common concepts most diagramming tools follow in the current market.
These factors are the rules established by existing vendors (and customers).
If you want to participate in their market, you have to follow their rules, but there is an even better strategy to become successful:
Go for a new market and create your own rules!
Changing the rules
Instead of copying the behavior of existing UML tools, UMLBoard tries to provide new value by focusing on principal factors not adequately covered by other design tools.
Again, the Blue Ocean Strategy suggests applying one of four actions to each of these factors:
- Eliminate each element that does not provide any value to the customer. Let’s look, for example, at the online subscription model: While it helps vendors stay in contact with their users and ensures constant revenue, it hardly provides any value for the users.
- Reduce the functionality to the bare minimum and cut off all unrelated features. For example, is it necessary to support all UML diagrams, or can one focus on a subset of the most important ones? Eliminating and reducing are crucial actions, as they allow to free up resources for the following activities, which are
- Increase features that provide real benefit and are otherwise missing from existing tools. For example, general drawing tools don’t offer any UML validation. Increasing how much UML semantics a tool could understand (without being too restrictive here) would quickly provide some additional value.
- Create new value that none of the existing tools yet provide. This is maybe the most valuable action in this quartet, as it helps generate a unique selling purpose for your app. The USP of UMLBoard offers is its focus on conceptual drawings. It makes creating informal UML diagrams an explicit feature. In contrast, most other tools only support this in a rather implicit way (e.g., by using some kind of rudimentary hand-drawn-style filter hidden in the rendering options).
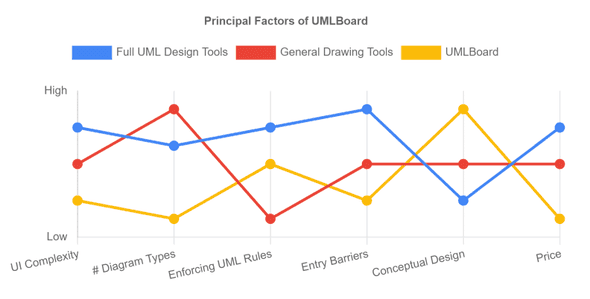
By applying these actions, we have a clear view of where UMLBoard can be located in our chart.

It supports only a single UML diagram type - class diagrams, which is considered the type of diagram with the most value (see here). Thanks to this restriction, the UI can be reduced dramatically. Also, most diagram editing happens inline, making additional modal dialogs for editing obsolete.
Unlike full UML model design tools, UMLBoard only supports a minimum set of UML validation rules. Just enough to help users by automatically updating references or relations, but not too many to restrict users in their creativity. Thus, users can add informal elements to the diagram or disable specific rules if desired.
Besides making the app easier to use, these reductions also have the advantage of freeing resources and reducing the overall development effort, which is an essential factor for side projects like UMLBoard.
The pricing model is a transparent pay-once single-price model without any additional subscription fee. This reduces the entry barriers, as users don’t have to register online to use the tool, and eliminates the need for backend infrastructure to handle the login and registration process.
These factors and how they are implemented by UMLBoard fill the gaps left by the other tools, which is also nicely visible in the above graph:
The line representing UMLBoard fits perfectly in the niche not covered by existing tools.
Final thoughts
Although the Blue Ocean Strategy contains many more ideas, I think the concepts I presented are a good starting point when planning your own product. Choosing the right principal factors that you use to characterize the market is undoubtedly the most exciting part of this game. Focusing on different key factors might result in a completely different app.
What factors do you consider critical when thinking about UML tools? Is there maybe even something essential I might have overlooked?
Please share your thoughts in the comments or via X (@UMLBoard).
Title image: Blue Ocean Vectors by Vecteezy
- Kim, W. Chan, and Renée Mauborgne. Blue ocean strategy, expanded edition: How to create uncontested market space and make the competition irrelevant. Harvard business review Press, 2014.↩
